Complete survey results available here.
In the following essays, we identify some of the key findings from the sixth annual Education Next-PEPG Survey, a nationally representative sample of U.S. citizens interviewed during April and May of 2012 (for survey methodology, see sidebar). Highlights include
• the Republican tilt of the education views of independents
• the especially high marks that Hispanics give their public schools
• strong support among the general public for using test-score information to hold teachers accountable
• lower confidence in teachers than has previously been reported
• the public’s (and teachers’) growing uneasiness with teachers unions
• the shaky foundations of public support for increased spending
• majority support for a broad range of school choice initiatives.
In addition to the views of the public as a whole, in this year’s survey special attention is paid to Hispanics, African Americans, parents, and teachers, all of whom were oversampled in order to obtain a sufficient number of observations. And in an effort to assess the sensitivity of respondents’ opinions to information and question wording, we embedded in this survey, as we have done in previous ones, various experiments. Responses to all questions are posted on our website, www.educationnext.org.
Independents lean Republican in their views of teachers unions and school spending—and support private school choice.
 With Barack Obama and Mitt Romney running neck and neck, the nation’s eyes are trained on independent voters, who will likely decide the presidential election. And in the days leading up to the national conventions, education policy, though hardly at the top of the public agenda, did assume a more prominent role in both campaigns. Which candidate is best positioned to use education to bring undecided voters into the fold? The answer may be surprising.
Just one-third of independents report that President Obama has done an “excellent” or “good” job of handling education issues, while the rest assign him a “fair” or “poor” rating. And on the education policy issues that most clearly divide the parties—the role of teachers unions and support for school spending—the views of independents hew closer to those of Republicans than of Democrats. Moreover, independents are more supportive than members of either party of expanding private school choice for disadvantaged students, the centerpiece of Governor Romney’s proposals for K–12 education reform.
Whereas 25 percent of respondents to the EdNext-PEPG survey report that they are Republicans and 34 percent say that they are Democrats, fully 41 percent claim no affiliation with either major party. Of this group, 52 percent claim that they lean Democratic, while just 40 percent lean Republican. On key education issues, however, these independents express views that better align with Republicans.
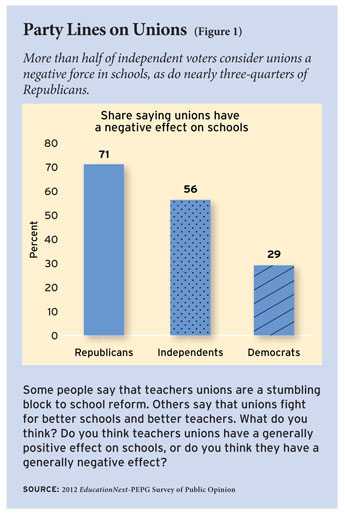
 No single education issue divides Republicans and Democrats more sharply than the role of teachers unions (see Figure 1). Seventy-one percent of Republicans report that the teachers unions have a generally negative effect on schools, as compared to just 29 percent of Democrats. Though independents come down in between, a majority of them (56 percent) agree with Republicans that unions have a negative effect.
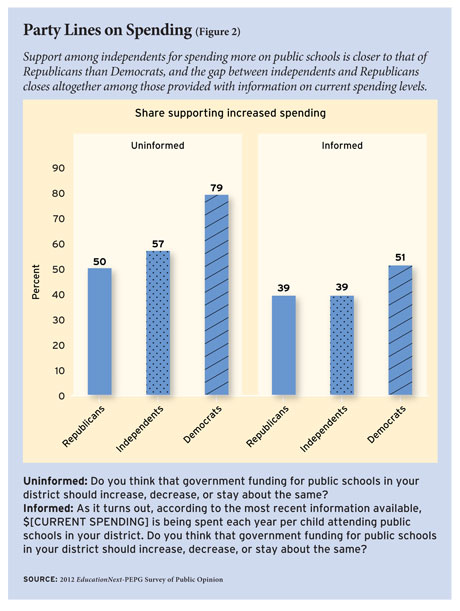
Republican and Democratic voters also diverge in their preferences on school spending and teacher salaries. Figure 2 shows that when not provided with information about current spending levels, 79 percent of Democrats say that spending on public schools in their local district should increase, as compared with 50 percent of Republicans. Among independents, 57 percent support increased spending, again placing them closer to Republicans in their view of the issue. And when respondents are informed about current spending levels, the gap between Republicans and independents vanishes: 39 percent of both groups support spending increases, compared to just 51 percent of Democrats.
 The same pattern holds for teacher salaries: when respondents are not provided with information about current salary levels, 60 percent of independents support increasing teacher salaries, placing them closer to Republicans (54 percent of whom support increases) than to Democrats (75 percent). Providing information on current teacher salaries in their state reduces support for salary increases among independents to 34 percent—exactly the same as among Republicans. Information also shrinks the share of Democrats supporting salary increases to 41 percent.
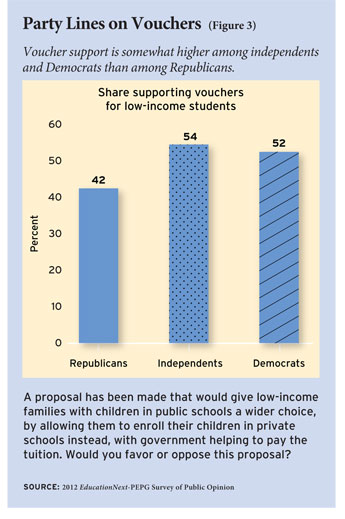
Governor Romney has made the expansion of school choice for disadvantaged students central to his campaign, calling for the expansion of the Washington, D.C., voucher program and for allowing low-income and special education students to use federal funds to enroll in private schools. It is perhaps surprising, then, to find that Republicans are less supportive of this concept than are Democrats (see Figure 3). Just 42 percent of Republicans express support for the idea, compared to 52 percent of Democrats. Voucher support among independents appears to be as high as (or greater than) it is among Democrats, at 54 percent.
Hispanics like public schools but not all union demands in contract negotiations.
Increasingly, both the Republican and Democratic parties have sought ways to court Hispanics. Though they lean Democratic—63 percent of Hispanic adults approve of the way President Barack Obama is handling his job as president—they are not as blue as is the African American community, 92 percent of whom give Obama a thumbs-up.
Those seeking the Hispanic vote in 2012 should know that education is an issue that resonates with the Latino community. Almost 60 percent of those we surveyed say they are “very” or “quite a bit” interested in education issues, as compared to less than 40 percent of African American and white voters.
On many topics—including school vouchers, charter schools, digital learning, student and school accountability, common core standards, and teacher recruitment and retention policies—the views of Hispanic adults do not differ noticeably from those of either whites or African Americans.
But in certain domains—estimates of school costs and school quality, support for teachers unions, teacher tenure, and teacher pensions—the views of Hispanics differ rather substantially. Their judgment of the American school is generous, perhaps because they compare public schools in the United States to much less effective institutions in Mexico, Cuba, and other parts of Latin America. They also underestimate the costs of running public schools, though they revise their thinking rather substantially about the merits of spending increases once they learn the facts. They are less supportive of unions and union demands than are African Americans.
Nearly 40 percent of Hispanic adults give the nation’s public schools a grade of an “A” or a “B” on the traditional scale used to evaluate schools (see Figure 4). When asked about the public schools in their community, no less than 55 percent give such favorable assessments. By comparison, whites and African Americans express significantly less enthusiasm about the nation’s schools. Less than 20 percent of whites and African Americans accord the nation’s schools an “A” or a “B,” and only around 40 percent give the schools in their community one of these two top grades. 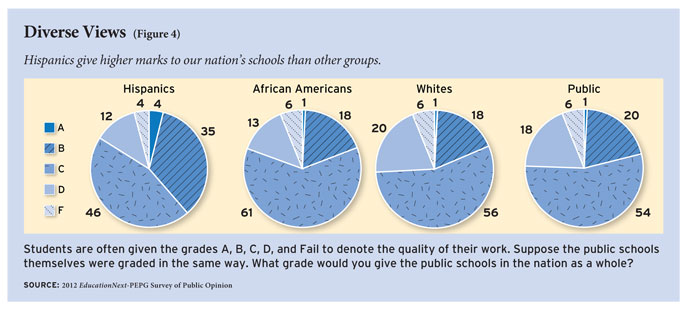
Hispanic respondents think American students perform better academically than is actually the case. American 15-year-olds ranked no better than 25th among the 34 developed democracies participating in the latest round of international tests. Yet nearly 45 percent of Hispanics say student math performance in the United States ranks among the top 15 countries in the world in math. Only 30 percent of white and African American respondents place the United States that high.
Hispanic respondents also think the public schools cost a lot less than they actually do. While annual per-pupil expenditures run around $12,500, Hispanics, on average, estimate their cost at less than $5,000. Whites and African Americans estimate the costs to be more than $7,000.
The same goes for teacher salaries, which average about $56,000 a year. On average, Hispanics think teachers are paid little more than $25,000 a year; blacks, on average, think they are paid around $30,000 a year; and whites estimate salaries at $35,000.
When told just how much schools cost, however, Hispanic respondents adjust their thinking quite dramatically. When informed about actual per-pupil expenditures, Hispanics’ support for higher taxes to fund spending increases drops from 46 percent to 25 percent. When given the actual amount teachers receive, their support for higher salaries plummets nearly in half—from over 60 percent to little more than 30 percent.
Although learning the truth about costs and salaries has a similar impact on white opinion, African Americans remain more committed to higher spending. Thirty-seven percent of African Americans favor higher taxes, even when told how much is currently being spent, only a slight dip from the 42 percent favorable when that information is withheld. When given the facts about teacher salaries, African American support for higher salaries drops 20 percentage points—from 74 percent to 54 percent.
Like other ethnic groups, Hispanics do not appear especially sympathetic to teachers union demands in collective bargaining negotiations. Sixty-two percent of Hispanic adults think teachers should pay 20 percent of their pension and health care costs, as do 56 percent of African Americans.
By an overwhelming margin (87 percent), Hispanic respondents favor proposals to condition teacher tenure on their students’ making adequate progress on state tests. Whites and African Americans also favor such proposals but not to the same degree (75 percent and 80 percent, respectively). When it comes to whether teachers unions are playing a more positive or a more negative role in their local community, Hispanic adults come out in the middle—at 59 percent in support, they are more supportive than whites (45 percent) but less supportive than African Americans (75 percent).
Use test scores for evaluations, says the public (but not the teachers).
Teachers have long been paid primarily on the basis of their academic credentials and years of experience, creating in most parts of the country a lockstep pay scale that does not account for a teacher’s classroom performance. This approach is often justified on the grounds that it precludes favoritism on the part of principals, school board members, and other administrative officials.
As teacher effectiveness has become an increasingly visible policy issue, standard approaches to salary and tenure decisions are undergoing substantial change. More than 20 states now require that student test-score gains be used in key personnel decisions, often including tenure and salary determinations. Four states go so far as to prohibit a teacher from receiving a top rating if students do not exceed a certain level of accomplishment, while another 10 require that achievement gains constitute at least 50 percent of each teacher’s evaluation.
Is the public onboard with these changes? And what do teachers think about them? To find out, we randomly divided those interviewed into two groups (see Figure 5). The first group was given a stark choice: How much weight should be given to test scores and how much should be given to principal recommendations? 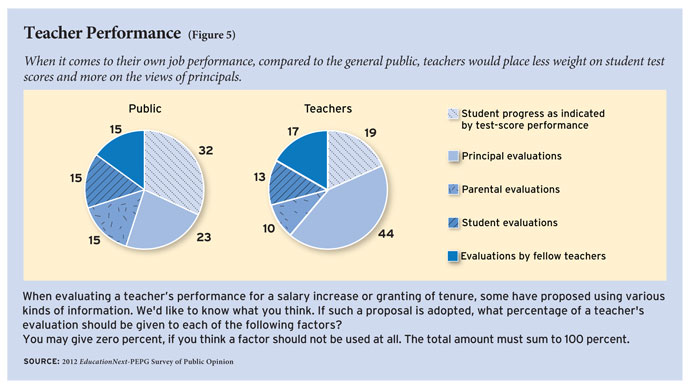
Given this simple dichotomy, the public says test-score gains should be given more than half the weight (62 percent) in making salary and tenure decisions. Teachers, by contrast, are prepared to place only a quarter of the weight (24 percent) on this information, with the other three-fourths of the weight being given to principal recommendations.
The second half of the sample was asked a more complex question, which required giving weights to test scores and evaluations from four different sources: principals, parents, students, and fellow teachers.
When the question was posed this way, the public and the teachers once again disagree. The public would place about one-third of the weight (32 percent) on test scores, but teachers would assign them less than one-fifth (19 percent). Conversely, teachers would give principal recommendations nearly half the weight (44 percent), while the public would give their recommendations less than one-quarter (23 percent).
 Perhaps surprisingly, teachers are unenthusiastic about being evaluated by their fellow teachers. Like the rest of the public, they divide up the remaining weight more or less equally among the three remaining sources of evidence (students, parents, and fellow teachers).
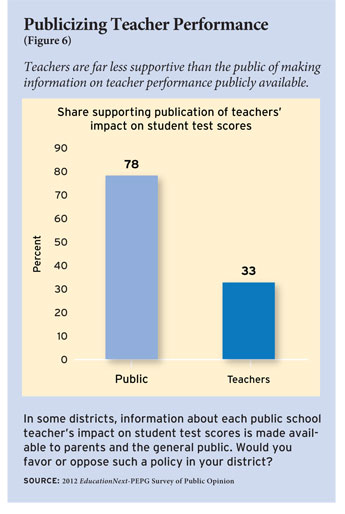
An even bigger gap between teachers and the public emerges on the desirability of releasing information about teacher performance to the public at large. In both New York City and Los Angeles, newspapers have published such information, provoking an outcry among teachers, who felt their privacy had been invaded. When we asked respondents about this as a general practice, 78 percent of the public expresses support, compared to just 33 percent of teachers (see Figure 6).
When given the option of expressing neutrality on the issue (as another randomly chosen half of the sample was), 60 percent of the public still says it supports the publication of information about teacher performance, while only 13 percent is opposed, the remaining 27 percent taking the neutral position. Teacher opinion is almost the mirror image. Fifty-four percent oppose making information on test-score impacts publicly available, 30 percent express support, with the remaining 16 percent not taking a clear position either way.
Are teachers unions undermining teacher popularity?
Teachers have long held a cherished place in American popular culture. In such films as Blackboard Jungle, Stand and Deliver, and Dead Poets Society, Hollywood has highlighted the power of teachers to utterly transform the lives of their students.
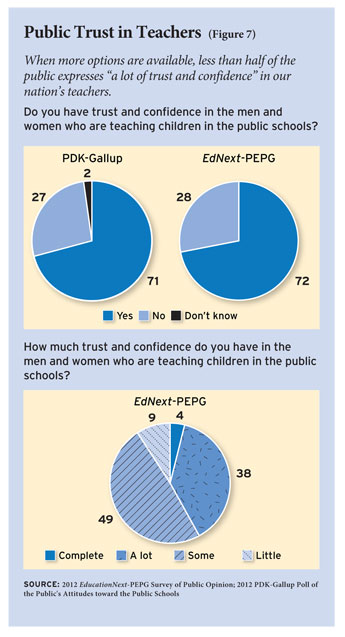 But is this now changing? Are Waiting for Superman, Bad Teacher, and Won’t Back Down (forthcoming “A Takeover Tale,” cultured, Winter 2013) harbingers of a new, more skeptical depiction of teachers? At first, it would seem that public trust in teachers is widespread. When we asked half of the respondents in our survey whether they “have trust and confidence in the men and women who are teaching children in the public schools,” no less than 72 percent say “yes” (see Figure 7). This is almost exactly what Phi Delta Kappan (PDK), a publication sympathetic to teachers unions, found in its 2012 poll and about the same as in PDK polls in previous years.
When we expand the possible response categories, however, a somewhat different picture emerges. Only 4 percent of the American public has “complete” trust and confidence in teachers, and just 38 percent has “a lot” of trust and confidence in them. Meanwhile, 49 percent has “some” trust and confidence, and 9 percent has “little” trust and confidence. In other words, 58 percent of those surveyed express less than “a lot of trust and confidence” in the teaching force.
Since this is the first time the public has been asked to break its assessment of teachers into four categories, we cannot document any trends over time. But we do know that public opinion toward teachers unions—and teachers’ opinions of them, too—has turned in a negative direction. The portion who thinks that teachers unions have had a positive effect on their local schools has dropped by 7 percentage points over the past year. Among teachers, the downward shift is no less than 16 percentage points.
In this year’s survey, as we have done in the past, we asked the following question: “Some people say teachers unions are a stumbling block to school reform. Others say that unions fight for better schools and better teachers. What is your opinion? Do you think teachers unions have a generally positive view on your local schools, or do you think they have a generally negative effect?” Respondents could choose among five options: very positive, somewhat positive, neither positive nor negative, somewhat negative, and very negative.
In our polls from 2009 to 2011, we saw little change in public opinion. Around 40 percent of respondents took the neutral position, saying that unions had neither a positive nor a negative impact. The remainder were divided almost evenly, with the negative share just barely exceeding the positive.
This year, however, the teachers unions lost ground. While 41 percent of the public still takes the neutral position, the portion with a positive view of unions dropped 7 percentage points in the last year, from 29 percent to 22 percent.
The drop is even greater, in both magnitude and significance, among our nationally representative sample of teachers. At a time when, according to education journalist and union watchdog Mike Antonucci, the National Education Association has lost 150,000 members over the past two years, and projects to lose 200,000 more members by 2014, teacher discontent appears to be rising. Whereas 58 percent of teachers had a positive view of unions in 2011, only 43 percent do so in 2012. Meanwhile, the percentage of teachers holding negative views of unions nearly doubled during this period, from 17 percent to 32 percent.
But when that same question was posed in either/or terms to the public as a whole, respondents split down the middle: 51 percent say unions had a negative impact, while 49 percent say their effect was positive. Teachers, meanwhile, offered a more positive assessment. When forced to choose between just two options, 71 percent of teachers claim that unions are a force for good, whereas 29 percent see them as a stumbling block to reform.
Support for school spending is shaky.
With the U.S. economy trying to crawl back to recovery, an unemployment rate above 8 percent, and state and local governments facing the prospect of insolvency, many school districts have found it necessary to cut expenditures and personnel. In California, the cities of Stockton and San Bernardino have declared bankruptcy. In Michigan, the financially bankrupt Muskegon schools have been handed over to a for-profit charter organization. Cuts in arts programs and extracurricular activities are becoming commonplace. Nationwide, the number of school employees has drifted downward by as much as 5 percent in the past few years.
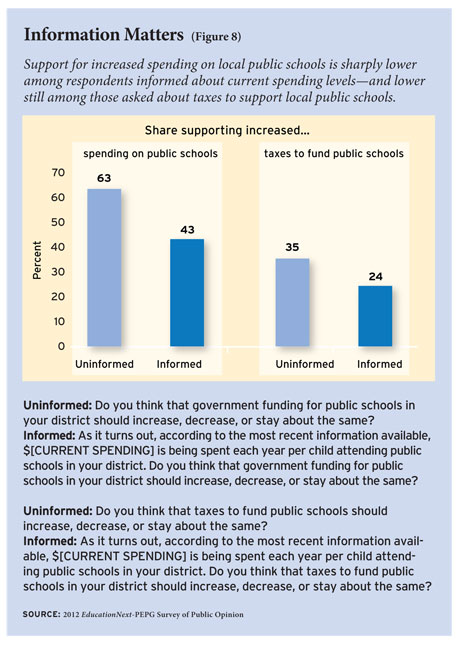 Still, the American public continues to support increasing spending on local public schools. Or at least it appears to do so (see Figure 8). Sixty-three percent of the general public says it prefers an increase in school expenditures in the local district, well up from levels in 2007 when only 51 percent of the public called for expenditure increases. Not surprisingly, teachers are even more enthusiastic about increasing expenditures, 68 percent of whom like the idea.
When one investigates the issue just a bit further, however, fractures can be detected in the public’s willingness to spend more on public schools. Though most Americans still offer their support for spending increases in the abstract, their enthusiasm ebbs rather substantially when the taxes needed to pay for the increased expenditures are broached and when information about actual expenditures and salaries is provided.
Part of the explanation for this is the widespread ignorance on the part of the general public about just how much already is spent on public schools. When asked to estimate per-pupil expenditure in their district, Americans guess that expenditures are about $6,500 annually, when in fact they are around $12,500. That is only a slightly better set of estimates than the ones given in 2009, when Americans thought $4,231 was being spent per pupil and the reality was closer to $10,000 (see “Educating the Public,” features, Summer 2009).
When respondents are told the correct figure, support for spending on public schools shifts sharply downward. Support for increased spending on our standard question drops by 20 percentage points, a much bigger drop than what was observed in 2009, when support for increased spending fell only 8 percentage points (from 46 percent to 38 percent).
In another sign of less-than-wholehearted support for an education spending spree, only 35 percent of the public says taxes should increase to fund the schools. Support drops by another 11 percentage points—to just 24 percent—when those interviewed were first told how much was currently being spent.
Teachers, who stand to benefit from increased expenditure, remain committed to more spending when told the realities of the expenditure situation in their district. Their support slips only 8 percentage points from the high of 68 percent when no information is supplied about current expenditures. But even teachers are 17 percentage points less likely to support higher taxes to fund increases in education spending.
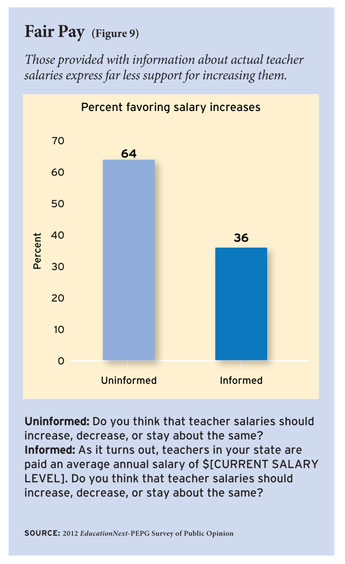 When the subject turns from per-pupil expenditures to teacher salaries, the same pattern emerges (see Figure 9). When asked without any accompanying information, nearly two out of three Americans think that teacher salaries should go up. Among teachers, support for a salary boost registers at no less than 85 percent.
As they do on per-pupil expenditures, however, Americans hold markedly inaccurate views about actual teacher salaries. When asked to hazard a guess, Americans estimate that public school teachers in their states receive, on average, about $36,000 in salary annually. The true figure, even without accounting for benefits, pensions, and the like, sits at about $56,000 nationwide.
Support for higher salaries plummets, however, when Americans are told how much teachers actually make in their states. Of those given the facts, only 36 percent favor an increase, which amounts to a whopping 28-percentage-point decline from the 64 percent favoring an increase when no information is supplied.
When teachers were given accurate information about salary levels in their state, their support slips by only 10 percentage points, probably because they are thinking about their own paycheck. Also, they have a better sense of teacher salaries in their state than the public has, estimating them to be about $44,000 annually.
Is public support for charters really that much higher than for vouchers and tax credits?
As a policy reform, school choice shows no signs of slowing. The number of states with school-voucher and tax-credit programs has escalated since 2010, the number of students attending charter schools climbs steadily year by year, and new technologies for online learning are being promoted by a cascade of new entrepreneurs.
The contours of elite debate about school choice, however, are not replicated in the larger public. While charter schools and digital learning are thought to be the safest choice options for political elites to promote, tax credits are even more popular than charters, and vouchers, the most controversial proposal, also command the support of half the population when the idea is posed in an inviting way.
Vouchers and tax credits. When it comes to school vouchers, apparent levels of public support turn on the wording of the question. For the past two years, PDK has asked whether respondents “favor or oppose allowing students and parents to choose a private school to attend at public expense.” Even with the rather loaded “at public expense” phrasing, PDK reported that support shifted upward from 34 percent to 44 percent between 2011 and 2012.
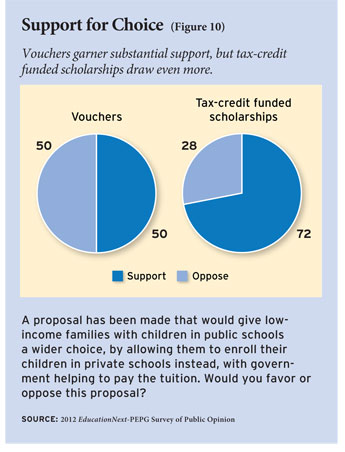 If one asks the question in a more inviting manner, as we have, support jumps further still (see Figure 10). Told about a proposal “that would give low-income families with children in public schools a wider choice, by allowing them to enroll their children in private schools instead, with government helping to pay the tuition,” 50 percent of the American public comes out in support and 50 percent expresses opposition.
Still, support for vouchers does not match public willingness to back tax credits, even though most economists think the difference between vouchers and tax credits more a matter of style than substance. Nearly three-fourths (72 percent) of the public favors a “tax credit for individual and corporate donations that pay for scholarships to help low-income parents send their children to private schools.” We find little evidence that support for tax credits has changed significantly since 2011.
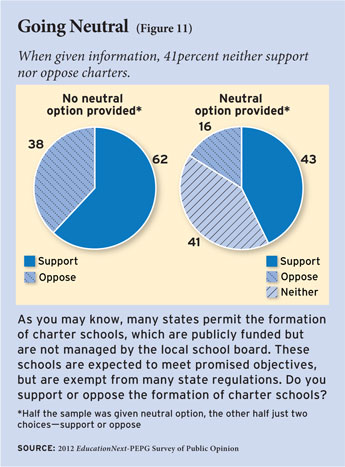 Charters. Figure 11 shows that when given a choice of supporting or opposing charter schools, 62 percent of the public says it favors ”the formation of charter schools,” nearly identical to what PDK finds (66 percent favoring ”the idea of charter schools”). Support for charters, however, is softer than it might seem. When respondents are given the opportunity to take a neutral position that neither supports nor opposes charters, no less than 41 percent choose that option. Among the remainder, the split is nearly three to one in favor of charters.
Meanwhile, public knowledge about charters remains as impoverished as ever. As our survey did two years ago, we asked respondents a variety of factual questions: whether charter schools can hold religious services, charge tuition, receive more or less per-pupil funding than traditional public schools, and are legally obligated to admit students randomly when oversubscribed. We found little change in the level of public information over the past two years. Large percentages of respondents still say they don’t know the answers to these questions. Among those who hazard a guess, they are as likely to give the wrong answer as the correct one. Although teachers do a better job of accurately identifying the characteristics of charter schools, even a majority of teachers get many of the answers wrong or say they don’t know.
Online education. As major universities—Harvard, Stanford, MIT, and others—are joining community colleges and state universities in a nationwide dash toward online learning in higher education, many states are exploring ways of incorporating new digital technologies into secondary schools.
A substantial share of both the public and the teaching force seems ready to consider the expansion of online learning. When asked if high school students should be allowed to take “approved classes either online or in school,” opinion splits down the middle, with a bare majority (53 percent to 47 percent) favoring the idea. Teachers are more enthusiastic, among whom no less than 61 percent feel students should be given an online option.
The public, however, is not equally enthusiastic about all uses of the online tool, nor is support for the idea gaining strength. The most popular uses are for rural education and advanced course taking. Fifty-eight percent of those surveyed think students in rural areas should have online opportunities, with only 14 percent opposing the idea. That is down modestly from the 64 percent who supported this use in 2008. Similar percentages of support and opposition are expressed for advanced courses taken online for college credit. But once again, levels of support have slipped since 2008 (from 68 percent to 57 percent in 2012).
Less popular are online courses for dropouts and home schoolers. Only 44 percent favor, and 30 percent oppose, using public funding to help dropouts take courses online. Many home schoolers find online courses to be a valuable tool, but the public remains dubious. Only 28 percent favors public funding for such uses, and 38 percent opposes it. Those percentages have not changed materially since 2008.
William G. Howell is professor of American politics at the University of Chicago. Martin R. West is assistant professor of education at the Harvard Graduate School of Education and deputy director of Harvard’s Program on Education Policy and Governance. Paul E. Peterson is the director of Harvard’s Program on Education Policy and Governance and senior fellow at the Hoover Institution.
This article appeared in the Winter 2013 issue of Education Next. Suggested citation format:
Howell, W.G., West, M.R., and Peterson, P.E. (2013). Reform Agenda Gains Strength: The 2012 EdNext-PEPG survey finds Hispanics give schools a higher grade than others do. Education Next, 13(1), 8-19.


