Read the unabridged version of this report here.
“The United States’ failure to educate its students leaves them unprepared to compete and threatens the country’s ability to thrive in a global economy.” Such was the dire warning issued recently by an education task force sponsored by the Council on Foreign Relations. Chaired by former New York City schools chancellor Joel I. Klein and former U.S. secretary of state Condoleezza Rice, the task force said the country “will not be able to keep pace—much less lead—globally unless it moves to fix the problems it has allowed to fester for too long.” Along much the same lines, President Barack Obama, in his 2011 State of the Union address, declared, “We need to out-innovate, out-educate, and out-build the rest of the world.”
Although these proclamations are only the latest in a long series of exhortations to restore America’s school system to a leading position in the world, the U.S. position remains problematic. In a report issued in 2010, we found only 6 percent of U.S. students performing at the advanced level in mathematics, a percentage lower than those attained by 30 other countries. And the problem isn’t limited to top-performing students. In 2011, we showed that just 32 percent of 8th graders in the United States were proficient in mathematics, placing the U.S. 32nd when ranked among the participating international jurisdictions (see “Are U.S. Students Ready to Compete?” features, Fall 2011).
Admittedly, American governments at every level have taken actions that would seem to be highly promising. Federal, state, and local governments spent 35 percent more per pupil—in real-dollar terms—in 2009 than they had in 1990. States began holding schools accountable for student performance in the 1990s, and the federal government developed its own nationwide school-accountability program in 2002.
And, in fact, U.S. students in elementary school do seem to be performing considerably better than they were a couple of decades ago. Most notably, the performance of 4th-grade students on math tests rose steeply between the mid-1990s and 2011. Perhaps, then, after a half century of concern and efforts, the United States may finally be taking the steps needed to catch up.
To find out whether the United States is narrowing the international education gap, we provide in this report estimates of learning gains over the period between 1995 and 2009 for 49 countries from most of the developed and some of the newly developing parts of the world. We also examine changes in student performance in 41 states within the United States, allowing us to compare these states with each other as well as with the 48 other countries.
Data and Analytic Approach
Data availability varies from one international jurisdiction to another, but for many countries enough information is available to provide estimates of change for the 14-year period between 1995 and 2009. For 41 U.S. states, one can estimate the improvement trend for a 19-year period—from 1992 to 2011. Those time frames are extensive enough to provide a reasonable estimate of the pace at which student test-score performance is improving in countries across the globe and within the United States. To facilitate a comparison between the United States as a whole and other nations, the aggregate U.S. trend is estimated for that 14-year period and each U.S. test is weighted to take into account the specific years that international tests were administered. (Because of the difference in length and because international tests are not administered in exactly the same years as the NAEP tests, the results for each state are not perfectly calibrated to the international tests, and each state appears to be doing slightly better internationally than would be the case if the calibration were exact. The differences are marginal, however, and the comparative ranking of states is not affected by this discrepancy.)
Our findings come from assessments of performance in math, science, and reading of representative samples in particular political jurisdictions of students who at the time of testing were in 4th or 8th grade or were roughly ages 9‒10 or 14‒15. The political jurisdictions may be nations or states. The data come from one series of U.S. tests and three series of tests administered by international organizations. Using the equating method described in the methodology sidebar, it is possible to link states’ performance on the U.S. tests to countries’ performance on the international tests, because representative samples of U.S. students have taken all four series of tests.
Comparisons across Countries
In absolute terms, the performance of U.S. students in 4th and 8th grade on the NAEP in math, reading, and science improved noticeably between 1995 and 2009. Using information from all administrations of NAEP tests to students in all three subjects over this time period, we observe that student achievement in the United States is estimated to have increased by 1.6 percent of a standard deviation per year, on average. Over the 14 years, these gains equate to 22 percent of a standard deviation. When interpreted in years of schooling, these gains are notable. On most measures of student performance, student growth is typically about 1 full standard deviation on standardized tests between 4th and 8th grade, or about 25 percent of a standard deviation from one grade to the next. Taking that as the benchmark, we can say that the rate of gain over the 14 years has been just short of the equivalent of one additional year’s worth of learning among students in their middle years of schooling.
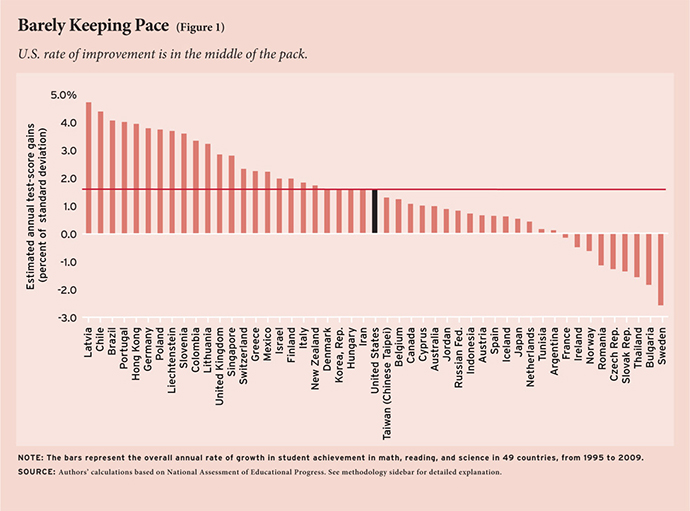
Yet when compared to gains made by students in other countries, progress within the United States is middling, not stellar (see Figure 1). While 24 countries trail the U.S. rate of improvement, another 24 countries appear to be improving at a faster rate. Nor is U.S. progress sufficiently rapid to allow it to catch up with the leaders of the industrialized world.
Students in three countries—Latvia, Chile, and Brazil—improved at an annual rate of 4 percent of a standard deviation, and students in another eight countries—Portugal, Hong Kong, Germany, Poland, Liechtenstein, Slovenia, Colombia, and Lithuania—were making gains at twice the rate of students in the United States. By the previous rule of thumb, gains made by students in these 11 countries are estimated to be at least two years’ worth of learning. Another 13 countries also appeared to be doing better than the U.S., although the differences between the average improvements of their students and those of U.S. students are marginal.
Student performance in nine countries declined over the same 14-year time period. Test-score declines were registered in Sweden, Bulgaria, Thailand, the Slovak and Czech Republics, Romania, Norway, Ireland, and France. The remaining 15 countries were showing rates of improvement that were somewhat slower than those of the United States.
In sum, the gains posted by the United States in recent years are hardly remarkable by world standards. Although the U.S. is not among the 9 countries that were losing ground over this period of time, 11 other countries were moving forward at better than twice the pace of the United States, and all the other participating countries were changing at a rate similar enough to the United States to be within a range too close to be identified as clearly different.
Which States Are the Big Gainers?
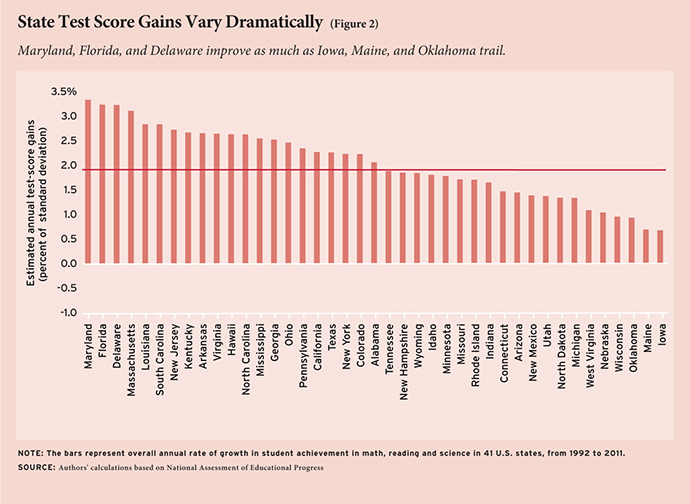
Progress was far from uniform across the United States. Indeed, the variation across states was about as large as the variation among the countries of the world. Maryland won the gold medal by having the steepest overall growth trend. Coming close behind, Florida won the silver medal and Delaware the bronze. The other seven states that rank among the top-10 improvers, all of which outpaced the United States as a whole, are Massachusetts, Louisiana, South Carolina, New Jersey, Kentucky, Arkansas, and Virginia. See Figure 2 for an ordering of the 41 states by rate of improvement.
Iowa shows the slowest rate of improvement. The other four states whose gains were clearly less than those of the United States as a whole are Maine, Oklahoma, Wisconsin, and Nebraska. Note, however, that because of nonparticipation in the early NAEP assessments, we cannot estimate an improvement trend for the 1992‒2011 time period for nine states—Alaska, Illinois, Kansas, Montana, Nevada, Oregon, South Dakota, Vermont, and Washington.
Cumulative growth rates vary widely. Average student gains over the 19-year period in Maryland, Florida, Delaware, and Massachusetts, with annual growth rates of 3.1 to 3.3 percent of a standard deviation, were some 59 percent to 63 percent of a standard deviation over the time period, or better than two years of learning. Meanwhile, annual gains in the states with the weakest growth rates—Iowa, Maine, Oklahoma, and Wisconsin—varied between 0.7 percent and 1.0 percent of a standard deviation, which translate over the 19-year period into learning gains of one-half to three-quarters of a year. In other words, the states making the largest gains are improving at a rate two to three times the rate in states with the smallest gains.
Had all students throughout the United States made the same average gains as did those in the four leading states, the U.S. would have been making progress roughly comparable to the rate of improvement in Germany and the United Kingdom, bringing the United States reasonably close to the top-performing countries in the world.
Is the South Rising Again?
Some regional concentration is evident within the United States. Five of the top-10 states were in the South, while no southern states were among the 18 with the slowest growth. The strong showing of the South may be related to energetic political efforts to enhance school quality in that region. During the 1990s, governors of several southern states—Tennessee, North Carolina, Florida, Texas, and Arkansas—provided much of the national leadership for the school accountability effort, as there was a widespread sentiment in the wake of the civil rights movement that steps had to be taken to equalize educational opportunity across racial groups. The results of our study suggest those efforts were at least partially successful.
Meanwhile, students in Wisconsin, Michigan, Minnesota, and Indiana were among those making the fewest average gains between 1992 and 2011. Once again, the larger political climate may have affected the progress on the ground. Unlike in the South, the reform movement has made little headway within midwestern states, at least until very recently. Many of the midwestern states had proud education histories symbolized by internationally acclaimed land-grant universities, which have become the pride of East Lansing, Michigan; Madison, Wisconsin; St. Paul, Minnesota; and Lafayette, Indiana. Satisfaction with past accomplishments may have dampened interest in the school reform agenda sweeping through southern, border, and some western states.
Are Gains Simply Catch-ups?
According to a perspective we shall label “catch-up theory,” growth in student performance is easier for those political jurisdictions originally performing at a low level than for those originally performing at higher levels. Lower-performing systems may be able to copy existing approaches at lower cost than higher-performing systems can innovate. This would lead to a convergence in performance over time. An opposing perspective—which we shall label “building-on-strength theory”—posits that high-performing school systems find it relatively easy to build on their past achievements, while low-performing systems may struggle to acquire the human capital needed to improve. If that is generally the case, then the education gap among nations and among states should steadily widen over time.
Neither theory seems able to predict the international test-score changes that we have observed, as nations with rapid gains can be identified among countries that had high initial scores and countries that had low ones. Latvia, Chile, and Brazil, for example—were relatively low-ranking countries in 1995 that made rapid gains, a pattern that supports catch-up theory. But consistent with building-on-strength theory, a number of countries that have advanced relatively rapidly were already high-performing in 1995—Hong Kong and the United Kingdom, for example. Overall, there is no significant pattern between original performance and changes in performance across countries.
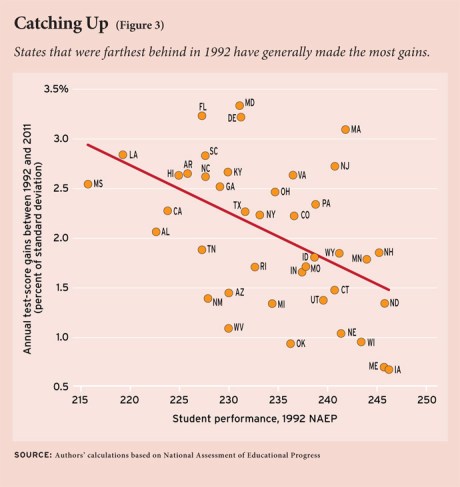
But if neither theory accounts for differences across countries, catch-up theory may help to explain variation among the U.S. states. The correlation between initial performance and rate of growth is a negative 0.58, which indicates that states with lower initial scores had larger gains. For example, students in Mississippi and Louisiana, originally among the lowest scoring, showed some of the most striking improvement. Meanwhile, Iowa and Maine, two of the highest-performing entities in 1992, were among the laggards in subsequent years (see Figure 3). In other words, catch-up theory partially explains the pattern of change within the United States, probably because the barriers to the adoption of existing technologies are much lower within a single country than across national boundaries.
Catch-up theory nonetheless explains only about one-quarter of the total state variation in achievement growth. Notice in Figure 3 that some states are well below the line (e.g., Iowa and Maine) while others are well above (e.g., Maryland and Massachusetts). Note also that Iowa, Maine, Wisconsin, and Nebraska rank well below that line. Closing the interstate gap does not happen automatically.
What about Spending Increases?
According to another popular theory, additional spending on education will yield gains in test scores. To see whether expenditure theory can account for the interstate variation, we plotted test-score gains against increments in spending between 1990 and 2009. As can be seen from the scattering of states into all parts of Figure 4, the data offer precious little support for the theory. Just about as many high-spending states showed relatively small gains as showed large ones. Maryland, Massachusetts, and New Jersey enjoyed substantial gains in student performance after committing substantial new fiscal resources. But other states with large spending increments—New York, Wyoming, and West Virginia, for example—had only marginal test-score gains to show for all that additional expenditure. And many states defied the theory by showing gains even when they did not commit much in the way of additional resources. It is true that on average, an additional $1000 in per-pupil spending is associated with an annual gain in achievement of one-tenth of 1 percent of a standard deviation. But that trivial amount is of no statistical or substantive significance. Overall, the 0.12 correlation between new expenditure and test-score gain is just barely positive.
Who Spends Incremental Funds Wisely?
Some states received more educational bang for their additional expenditure buck than others. To ascertain which states were receiving the most from their incremental dollars, we ranked states on a “points per added dollar” basis. Michigan, Indiana, Idaho, North Carolina, Colorado, and Florida made the most achievement gains for every incremental dollar spent over the past two decades. At the other end of the spectrum are the states that received little back in terms of improved test-score performance from increments in per-pupil expenditure—Maine, Wyoming, Iowa, New York, and Nebraska.
We do not know, however, which kinds of expenditures prove to be the most productive or whether there are other factors that could explain variation in productivity among the states.
Causes of Change
There is some hint that those parts of the United States that took school reform the most seriously—Florida and North Carolina, for example—have shown stronger rates of improvement, while states that have steadfastly resisted many school reforms (Iowa and Wisconsin, for instance), are among the nation’s test-score laggards. But the connection between reforms and gains adduced thus far is only anecdotal, not definitive. Although changes among states within the United States appear to be explained in part by catch-up theory, we cannot pinpoint the specific factors that underlie this. We are also unable to find significant evidence that increased school expenditure, by itself, makes much of a difference. Changes in test-score performance could be due to broader patterns of economic growth or varying rates of in-migration among states and countries. Of course, none of these propositions has been tested rigorously, so any conclusions regarding the sources of educational gains must remain speculative.
Have We Painted Too Rosy a Portrait?
Even the extent of the gains that have been made are uncertain. We have estimated gains of 1.6 percent of a standard deviation each year for the United States as a whole, or a total gain of 22 percent of a standard deviation over 14 years, a forward movement that has lifted performance by nearly a full year’s worth of learning over the entire time period. A similar rate of gain is estimated for students in the industrialized world as a whole (as measured by students residing in the 49 participating countries). Such a rate of improvement is plausible, given the increased wealth in the industrialized world and the higher percentages of educated parents than in prior generations.
However, it is possible to construct a gloomier picture of the rate of the actual progress that both the United States and the industrialized world as a whole have made. All estimations are normed against student performances on the National Assessment of Educational Progress in 4th and 8th grades in 2000. Had we estimated gains from student performance in 8th grade only on the grounds that 4th-grade gains are meaningless unless they are observed for the same cohort four years later, our results would have shown annual gains in the United States of only 1 percent of a standard deviation. The relative ranking of the United States remains essentially unchanged, however, as the estimated growth rates for 8th graders in other countries is also lower than for estimates that include students in 4th grade (see the unabridged report, Appendix B, Figure B1).
A much reduced rate of progress for the United States emerges when we norm the trends on the PISA 2003 test rather than the 2000 NAEP test. In this case, we would have estimated annual growth rate for the United States of only one-half of 1 percent of a standard deviation. A lower annual growth rate for other countries would also have been estimated, and again the relative ranking of the United States would remain unchanged (see the unabridged report, Appendix B, Figure B2).
An even darker picture emerges if one turns to the results for U.S. students at age 17, for whom only minimal gains can be detected over the past two decades. We have not reported the results for 17-year-old students, because the test administered to them does not provide information on the performance of students within individual states, and no international comparisons are possible for this age group.
Students themselves and the United States as a whole benefit from improved performance in the early grades only if that translates into measurably higher skills at the end of school. The fact that none of the gains observed in earlier years translate into improved high-school performance leaves one to wonder whether high schools are effectively building on the gains achieved in earlier years. And while some scholars dismiss the results for 17-year-old students on the grounds that high-school students do not take the test seriously, others believe that the data indicate that the American high school has become a highly problematic educational institution. Amidst any uncertainties one fact remains clear, however: the measurable gains in achievement accomplished by more recent cohorts of students within the United States are being outstripped by gains made by students in about half of the other 48 participating countries.
Methodology
Our international results are based on 28 administrations of comparable math, science, and reading tests between 1995 and 2009 to jurisdictionally representative samples of students in 49 countries. Our state-by-state results come from 36 administrations of math, reading, and science tests between 1992 and 2011 to representative samples of students in 41 of the U.S. states. These tests are part of four ongoing series: 1) National Assessment of Educational Progress (NAEP), administered by the U. S. Department of Education; 2) Programme for International Student Assessment (PISA), administered by the Organisation for Economic Co-operation and Development (OECD); 3) Trends in International Mathematics and Science Study (TIMSS), administered by the International Association for the Evaluation of Educational Achievement (IEA); and 4) Progress in International Reading Literacy Study (PIRLS), also administered by IEA.
To equate the tests, we first express each testing cycle (of grade by subject) of the NAEP test in terms of standard deviations of the U.S. population on the 2000 wave. That is, we create a new scale benchmarked to U.S. performance in 2000, which is set to have a standard deviation of 100 and a mean of 500. All other NAEP results are a simple linear transformation of the NAEP scale on each testing cycle. Next, we express each international test on this transformed NAEP scale by performing a simple linear transformation of each international test based on the U.S. performance on the respective test. Specifically, we adjust both the mean and the standard deviation of each international test so that the U.S. performance on the tests is the same as the U.S. NAEP performance, as expressed on the transformed NAEP scale. This allows us to estimate trends on the international tests on a common scale, whose property is that in the year 2000 it has a mean of 500 and a standard deviation of 100 for the United States.
Expressed on this transformed scale, estimates of overall trends for each country are based on all available data from all international tests administered between 1995 and 2009 for that country. Since a state or country may have specific strengths or weaknesses in certain subjects, at specific grade levels, or on particular international testing series, our trend estimations use the following procedure to hold such differences constant. For each state and country, we regress the available test scores on a year variable, indicators for the international testing series (PISA, TIMSS, PIRLS), a grade indicator (4th vs. 8th grade), and subject indicators (mathematics, reading, science). This way, only the trends within each of these domains are used to estimate the overall time trend of the state or country, which is captured by the coefficient on the year variable.
A country’s performance on any given test cycle (for example, PIRLS 4th-grade reading, TIMSS 8th-grade math) is only considered if the country participated at least twice within that respective cycle. To be included in the analysis, the time span between a country’s first and last participation in any international test must be at least seven years. A country must have participated prior to 2003 and more recently than 2006. Finally, for a country to be included there must be at least nine test observations available.
For the analysis of U.S. states, observations are available for only 41 states. The remaining states did not participate in NAEP tests until 2002. As mentioned, annual gains for states are calculated for a 19-year period (1992 to 2011), the longest interval that could be observed for the 41 states. International comparisons are for a 14-year period (1995 to 2009), the longest time span that could be observed with an adequate number of international tests. To facilitate a comparison between the United States as a whole and other nations, the aggregate U.S. trend is estimated from that same 14-year period and each U.S. test is weighted to take into account the specific years that international tests were administered. Because of the difference in length and because international tests are not administered in exactly the same years as the NAEP tests, the results for each state are not perfectly calibrated to the international tests, and each state appears to be doing slightly better internationally than would be the case if the calibration were exact. The differences are marginal, however, and the comparative ranking of states is not affected by this discrepancy.
A more complete description of the methodology is available in the unabridged version of this report.
Politics and Results
The failure of the United States to close the international test-score gap, despite assiduous public assertions that every effort would be undertaken to produce that objective, raises questions about the nation’s overall reform strategy. Education goal setting in the United States has often been utopian rather than realistic. In 1990, the president and the nation’s governors announced the goal that all American students should graduate from high school, but two decades later only 75 percent of 9th graders received their diploma within four years after entering high school. In 2002, Congress passed a law that declared that all students in all grades shall be proficient in math, reading, and science by 2014, but in 2012 most observers found that goal utterly beyond reach. Currently, the U.S. Department of Education has committed itself to ensuring that all students shall be college- or career-ready as they cross the stage on their high-school graduation day, another overly ambitious goal. Perhaps the least realistic goal was that of the governors in 1990 when they called for the U.S. to be first in the world in math and science by 2000. As this study shows, the United States is neither first nor catching up.
Consider a more realistic set of objectives for education policymakers, one that is based on experiences from within the United States itself. If all U.S. states could increase their performance at the same rate as the highest-growth states—Maryland, Florida, Delaware, and Massachusetts—the U.S. improvement rate would be lifted by 1.5 percentage points of a standard deviation annually above the current trend line. Since student performance can improve at that rate in some countries and in some states, then, in principle, such gains can be made more generally. Those gains might seem small but when viewed over two decades they accumulate to 30 percent of a standard deviation, enough to bring the United States within the range of, or to at least keep pace with, the world’s leaders.
Eric A. Hanushek is senior fellow at the Hoover Institution of Stanford University. Paul E. Peterson is director of the Harvard Program on Education Policy and Governance. Ludger Woessmann is head of the Department of Human Capital and Innovation at the Ifo Institute at the University of Munich. An unabridged version of this report is available at hks.harvard.edu/pepg/
This article appeared in the Fall 2012 issue of Education Next. Suggested citation format:
Hanushek, E.A., Peterson, P.E., and Woessmann, L. (2012). Is the U.S. Catching Up? International and state trends in student achievement. Education Next, 12(4), 24-33.


